DESI Quasars
Overview
Quasars are, in a broad sense, active galaxies. We define and discuss quasars earlier, in the write-up for the main quasars data set. We discuss the DESI mission more in DESI Galaxies.
Scientists call active galaxies AGNs, designating objects that have active galactic nuclei. AGN is an umbrella term that describes any galaxy whose compact center emits significant amounts of energy that is non-stellar in nature. This energy, which is emitted across the spectrum, is believed to result from the accretion of matter into a supermassive black hole at the galaxy’s center. While the Milky Way has a supermassive black hole at its center, as most galaxies do, it is not terribly active. It was last thought to be active about 8 billion years ago.
Note
The DESI Quasars are not included in any OpenSpace profile. You can add these to a profile using the Profile Editor.
Survey
The DESI quasars are distributed on the same footprint as the DESI galaxies since they are the same survey. We color the quasars red because they show no inherent structure akin to the galaxy surveys.
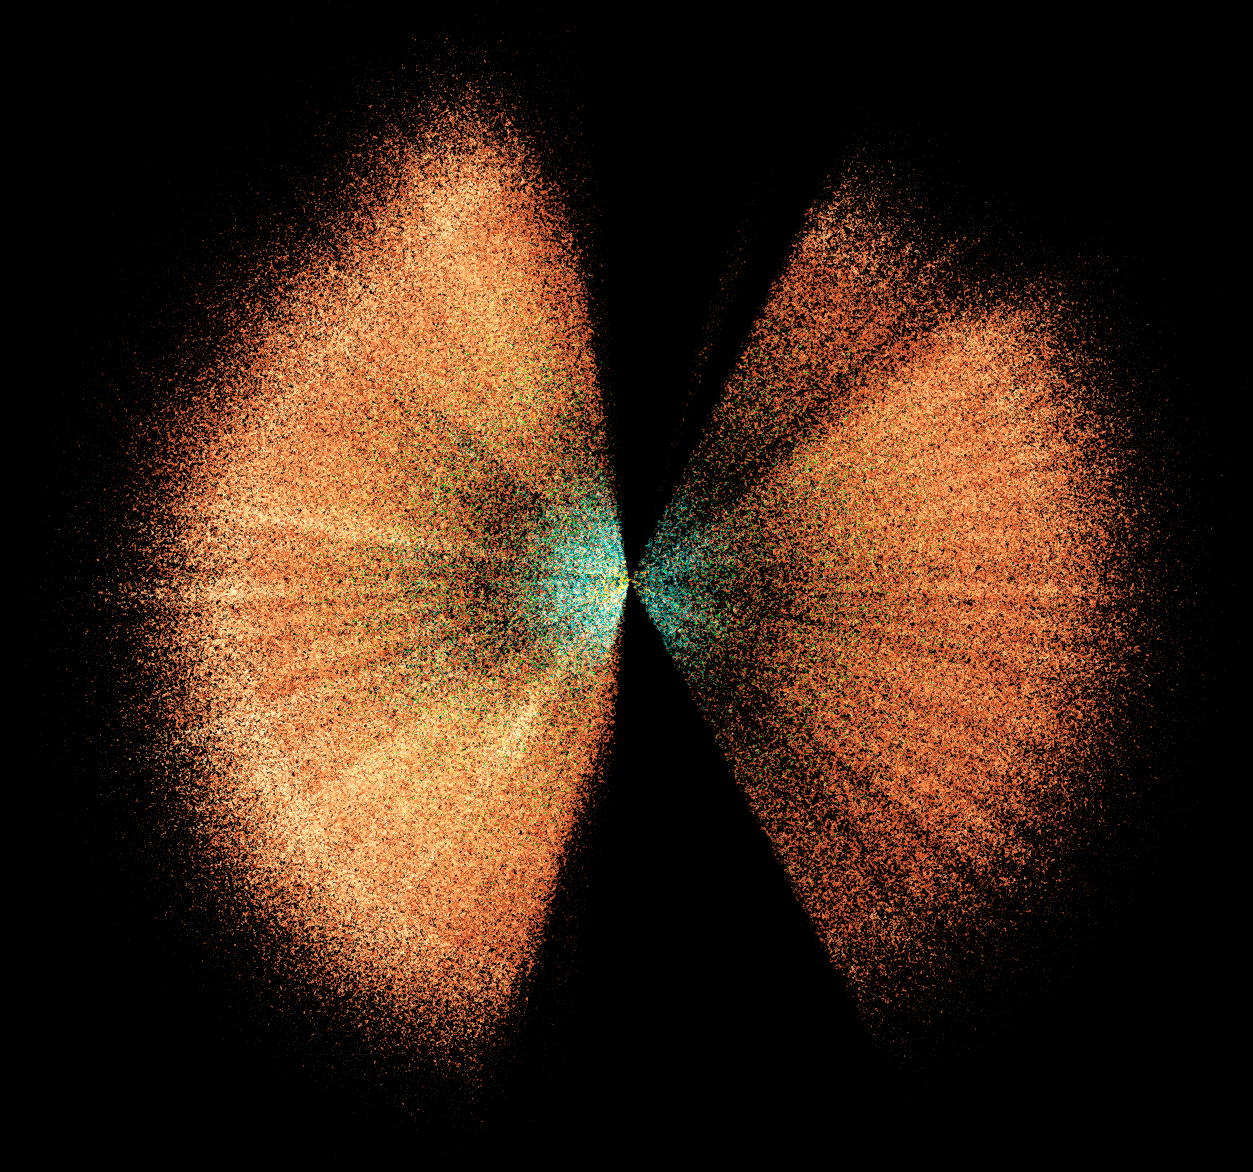
A face-on view of the DESI galaxies and the quasars. The galaxies are yellow, green, and aqua, and the quasars are red.
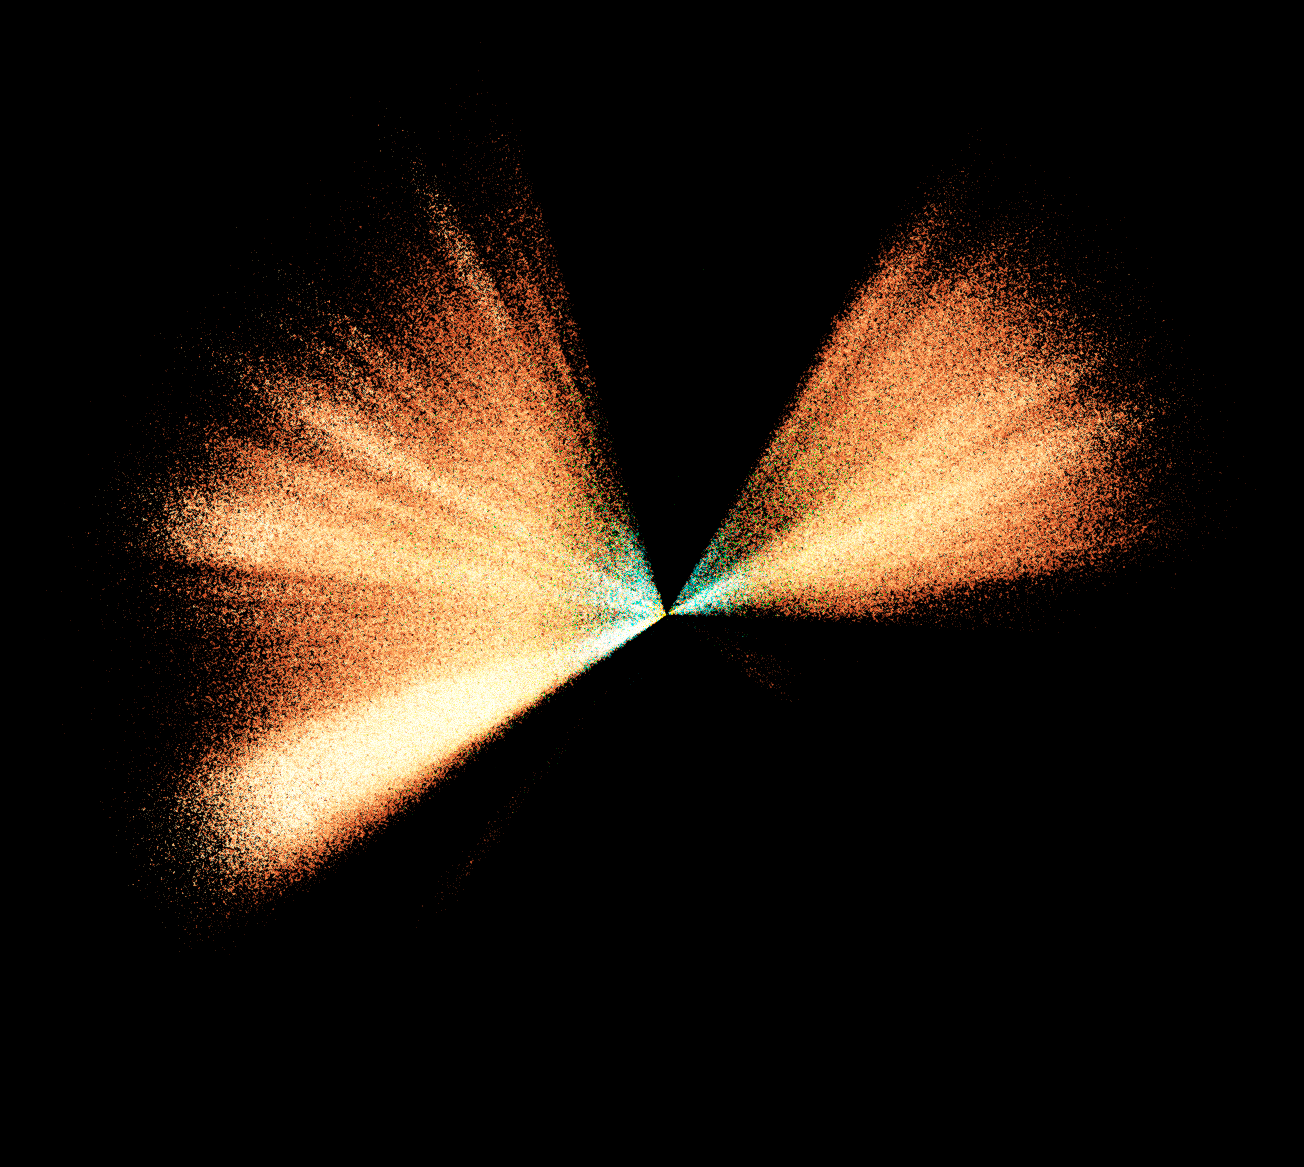
An edge-on view of the DESI galaxies and quasars. The quasars, colored red, show some overdensities where more observations were made.
Relative to the main quasar survey, the DESI quasars cover less volume, but they are much higher in density.
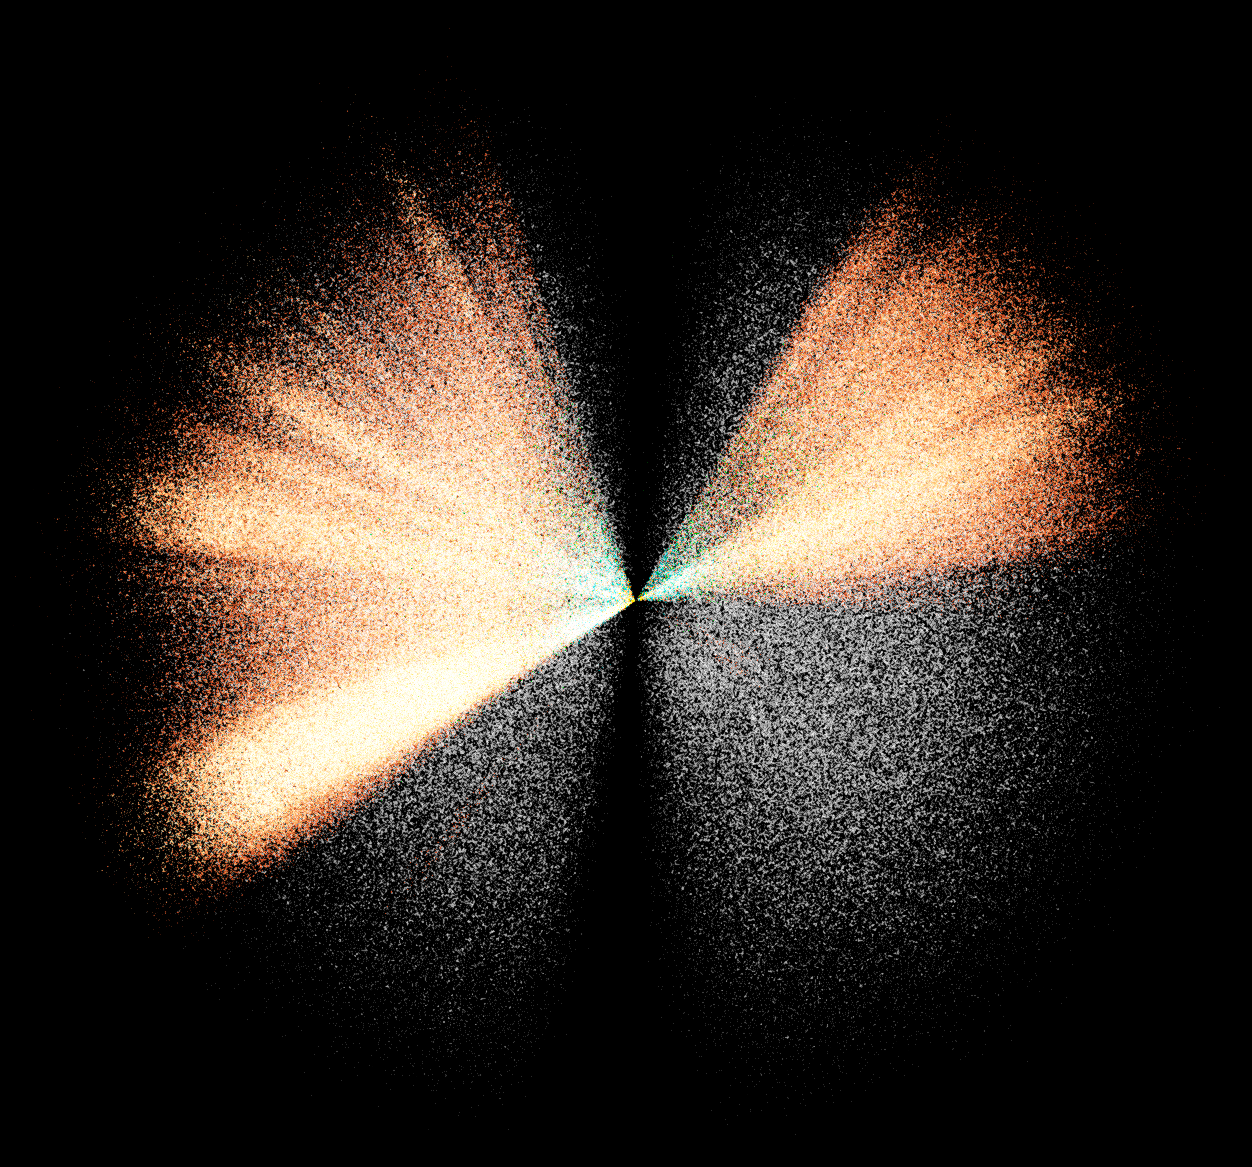
Comparison of the DESI quasars, in red, and the main Quasar Catalog, in white. The main catalog covers more volume around the Milky Way, but is far less dense than the DESI data.
Data Artifacts
Radial Overdensities
The DESI quasars share the same radial overdesities as the DESI galaxies—rays that point back to the Milky Way where more observations were made, so there appear to be more quasars. These will be less obvious in future data releases as more data are filled in.
The Lyman-alpha Forest Bump
With the quasar survey, there is an obvious overdensity toward the edge of the data. A concentric line where the number of quasars drastically goes up is readily apparent, particularly when rotating. This jump in data occurs at a redshift of 2.1. At this point, the Lyman-alpha forest lines redshift into the DESI spectral coverage and special measures were taken to observe galaxies beyond this redshift.
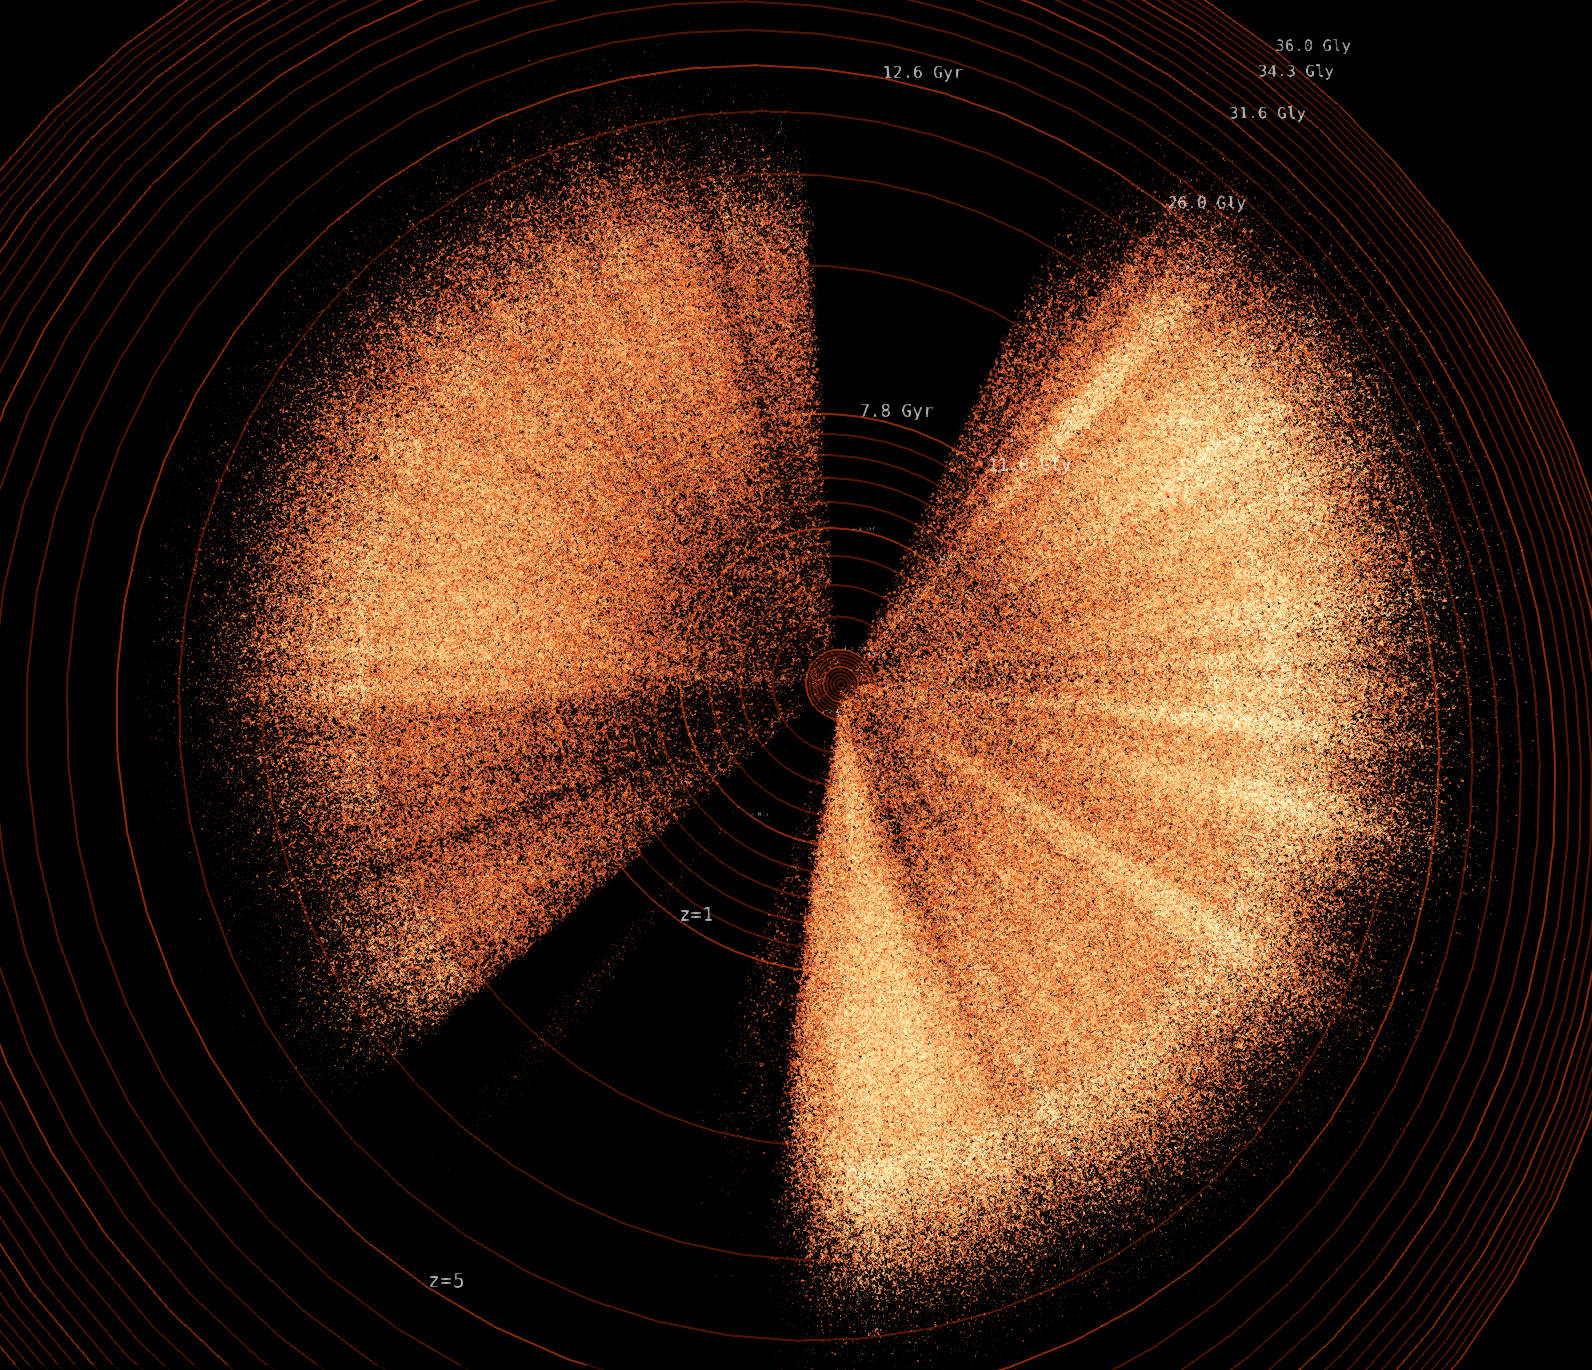
DESI qusasrs plotted against the redshift grid. The value of redshift, \(z\), is labeled toward the bottom-left corner, with labels for \(z=1\) and \(z=5\). To the upper-left corner is the distance in billions of light years (Gly), and toward the top are labels for the lookback time, how long the light took to travel to Earth in billions of years (Gly). The \(z=2.1\) overdensity is easily visible here.
The Lyman-alpha forest refers to neutral Hydrogen’s Lyman-alpha (Lyα) line, which normally occurs in the ultraviolet. Because quasars are at such high redshift, this emission line appears in the infrared in a their spectrum. However, there are intervening hydrogen gas clouds at lesser redshifts that absorb light at the Lyα line. So, the Lyα forest refers to a series of absorption lines that occur on the blue side of the quasar’s Lyα emission line. The farther the quasar, the more gas clouds exist between it and the observer on Earth, resulting in a broad swath of many Lyα absorption lines, one from each of the clouds at varying distances. These create a dense band of absorption in the spectrum, which astronomers call the Lyman-alpha forest.
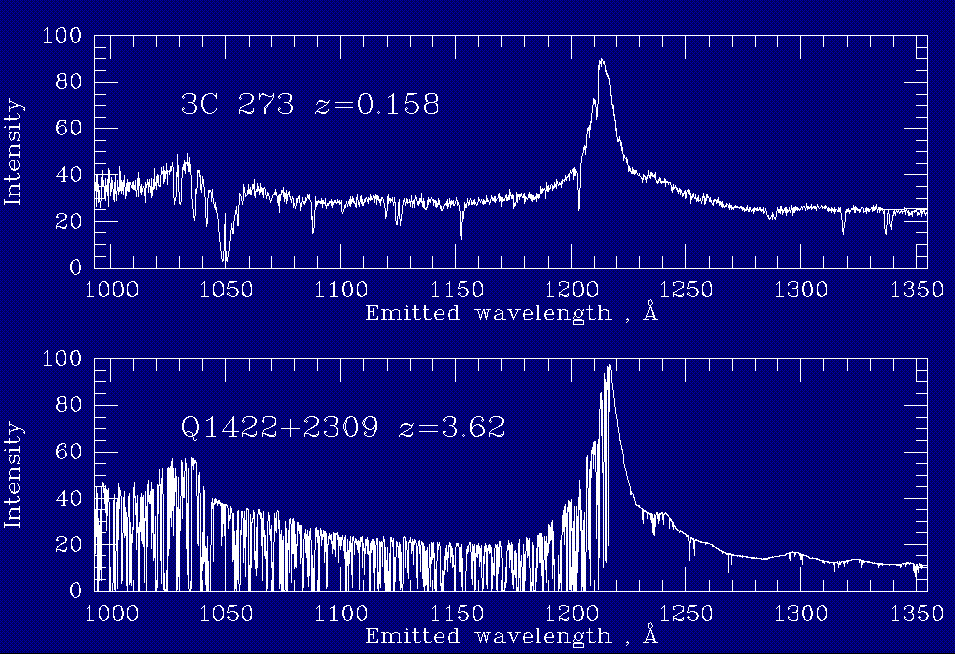
Spectra of two quasars, one relatively nearby, 3C 273 at redshift 0.158 (top), and another far more distant, Q1422+2309 at redshift 3.62 (bottom). Both have Lyα absorption lines to the right of the quasar’s Lyα emission line around 1215 Angstroms (these have been shifted to a common wavelength scale). A few Lyα absorption lines from the interveneing clouds appear in the spectrum for 3C 273, but the farther Q1422+2309 has hundreds of these lines to the left of the emission line. (Credit: 3C 273 data are from the HST archive; Q1422+2309 data were observed with Keck and were provided by Mike Rauch. Image by Bill Keel.)
For DESI, the Lyα forest begins to encroach on the DESI spectral coverage at a redshift of 2.1. That makes these quasars more valuable as probes of the large-scale structure at these distances. These objects are then placed on a list to be observed whenever possible, so the data at \(z \geq 2.1\) are more dense because there are more observations there.
Profiles
Note
By default, these data sets are not part of any profile.
You must add one or both of these into a profile via the Profile Editor.
Dossier
Census: |
2,182,309 quasars |
|---|---|
Asset File: |
|
OpenSpace Version: |
1 |
Reference: |
|
Prepared by: |
Cade Mohrhardt (AMNH), Brian Abbott (AMNH) |
Source Version: |
1.01 |
License: |