DESI Galaxies
Overview
DESI, the Dark Energy Spectroscopic Instrument, obtained data on tens of millions of galaxies and quasars probing deep into the universe. The instrument is mounted on the four-meter Mayall Telescope on Kitt Peak in Arizona. The overall idea of the project is to probe the expansion history of the universe, yielding insights on the physics of dark energy.
Note
Because of its size, we distribute the DESI Galaxies in two versions. The full version contains about 14 million galaxies, while the reduced version contains over 8 million galaxies. The reduced version culls many of the outer galaxies that do not exemplify the large-scale structure we see nearby.
Neither DESI Galaxies data set are included in any OpenSpace profile. You can add these to a profile using the Profile Editor.
Mission
DESI’s primary focus is to measure the expansion history of the universe. By measuring the density fluctuations in the visible matter of the universe, DESI constrains the cosmological parameters that reveal the nature of dark energy.
These density fluctuations, so called baryon acoustic oscillations, are acoustic density waves in the plasma of the early universe, before the era of recombination. Slight variations in the density of this plasma excited sound waves that traveled though this fluid. Once recombination occurred about 370,000 years after the Big Bang, when the plasma cooled enough to cause the free electrons and protons to combine into hydrogen, these waves were frozen in time. Where these waves created ripples is where more galaxies would eventually form into the large-scale structure we see today.
Akin to the notion of the “standard candle” luminosity of Type Ia supernovae that can reliably determine the distance to that supernova, the formations left from these baryon acoustic oscillations are said to be a “standard ruler” for their standard size (about 490 million light years). Once we measure its size from Earth, we know its distance based on its standard physical size.
DESI will measure these faint baryon acoustic oscillations imprinted into the present-day clustering of galaxies and quasars, and, along the way, will produce an accurate mapping of the 3-D universe to about a redshift of 4, or about 23 billion light years. The light from this distance took about 12 billion years to reach the telescope on earth.
The Survey
DESI subdivides its survey into several overlapping regions based on redshift, \(z\). The bright galaxy survey (\(0.0 < z < 0.6\)), the luminous red galaxies (\(0.4 < z < 1.1\)), emission-line galaxies (\(0.6 < z < 1.6\)), and quasars (\(0.9 < z < 4.0\)).
Each of these require different observing techniques. The bright galaxy survey are galaxies observed in bright-sky conditions. These include galaxies that are close to the Milky Way. Luminous red galaxies emit much of their energy in the infrared, and are massive, bright galaxies composed of older, redder stars. They act as a probe for large-scale structure because of their tendancy to be in clusters. Emission-line galaxies trace systems with increased rates of star formation. These are important because they are relatively easy to observe by measuring certain emission lines in their light, rather than requiring fidelity throughout the spectrum. Finally, quasars, which we will discuss in DESI Quasars, display emission lines driven by the active galactic nuclei (that is, the massive black hole at its center).
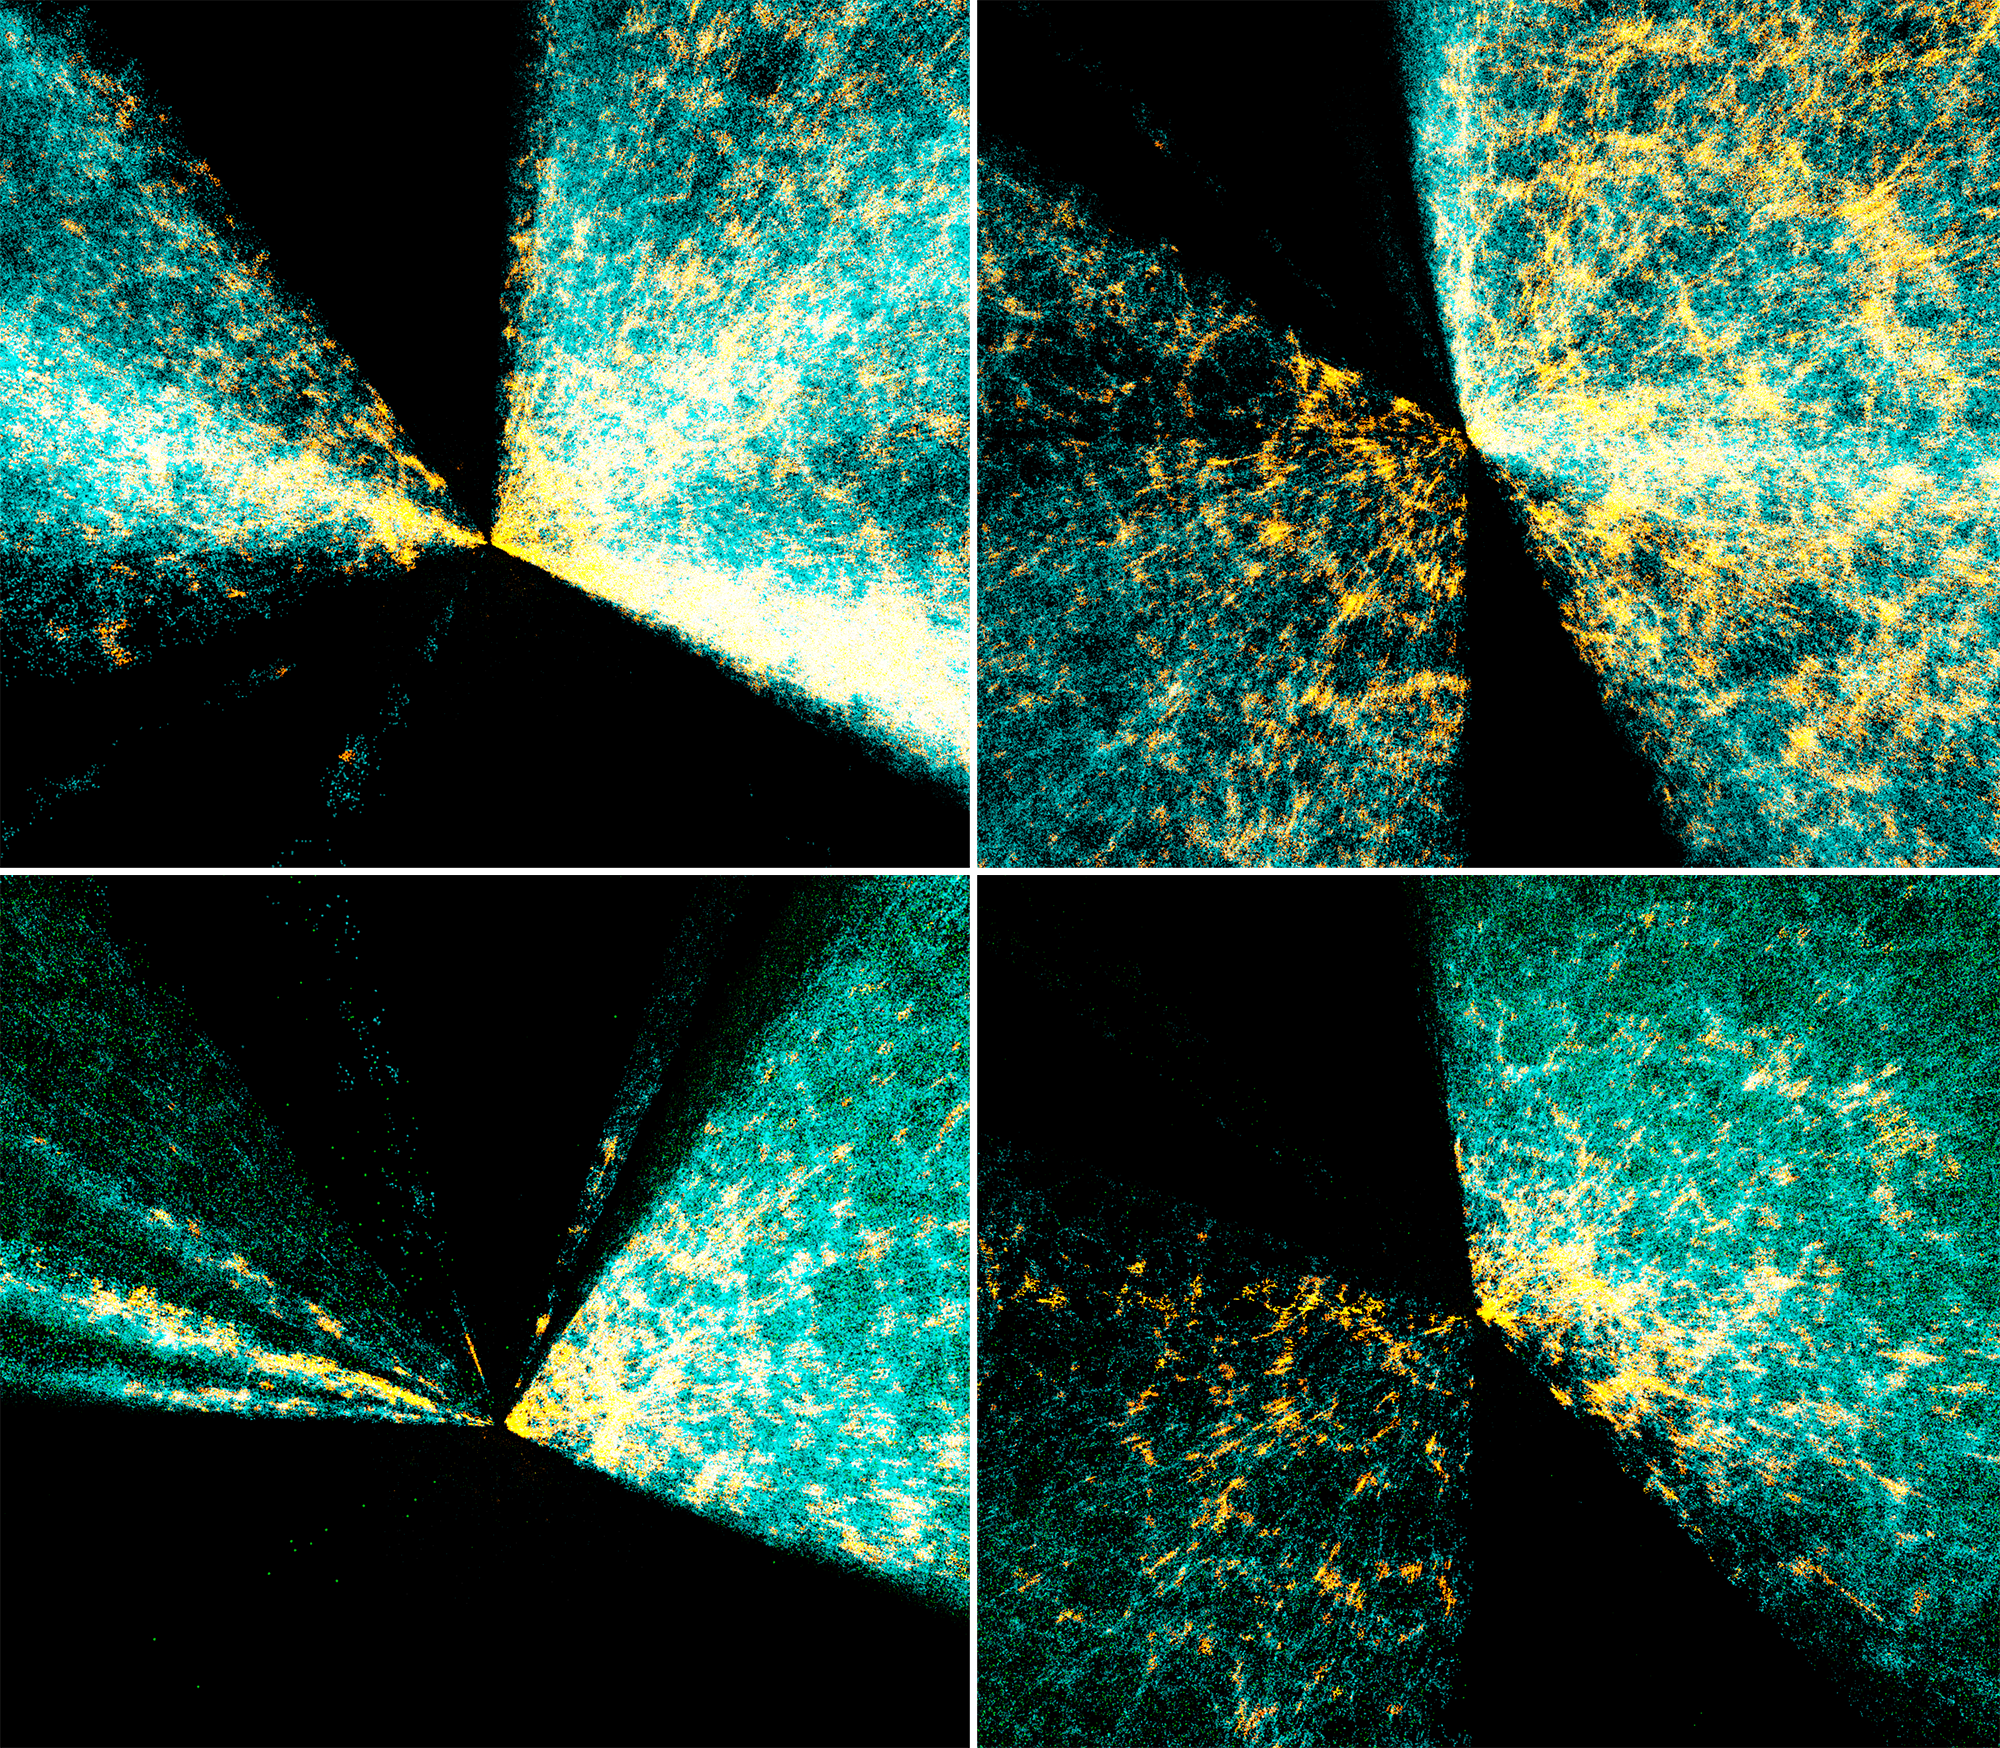
DESI-Sloan Comparison. In the top two panels, we see the DESI galaxies edge-on (left) and face-on (right). In the bottom two panels we see the same views but with the Sloan Digital Sky Survey galaxies. We can see the increased coverage of galaxies in the DESI data, and, more importantly, the amplification of the large-scale structure.
Full Versus Reduced Data
To accommodate variations in performance and capabilities, we produced two sets of DESI galaxy data. The full version speaks for itself, and contains about 14 million galaxies.
The Reduced version contains about 8 million galaxies. For each galaxy, as in all our galaxy catalogs, we determine the number of galaxies within a 5-megaparsec (16-million-light year) bubble surrounding that galaxy. This results in a number for each galaxy that traces the local density of galaxies. We use this value to set the color of each galaxy, orange for relatively dense areas, green for low-dense areas, and aqua for galaxies between these two extremes. We use this same number—the number of galaxies within 5 megaparsecs—to reduce the data set. By removing all the isolated galaxies that have zero neighbors within that bubble, we reduce the dataset by almost half.
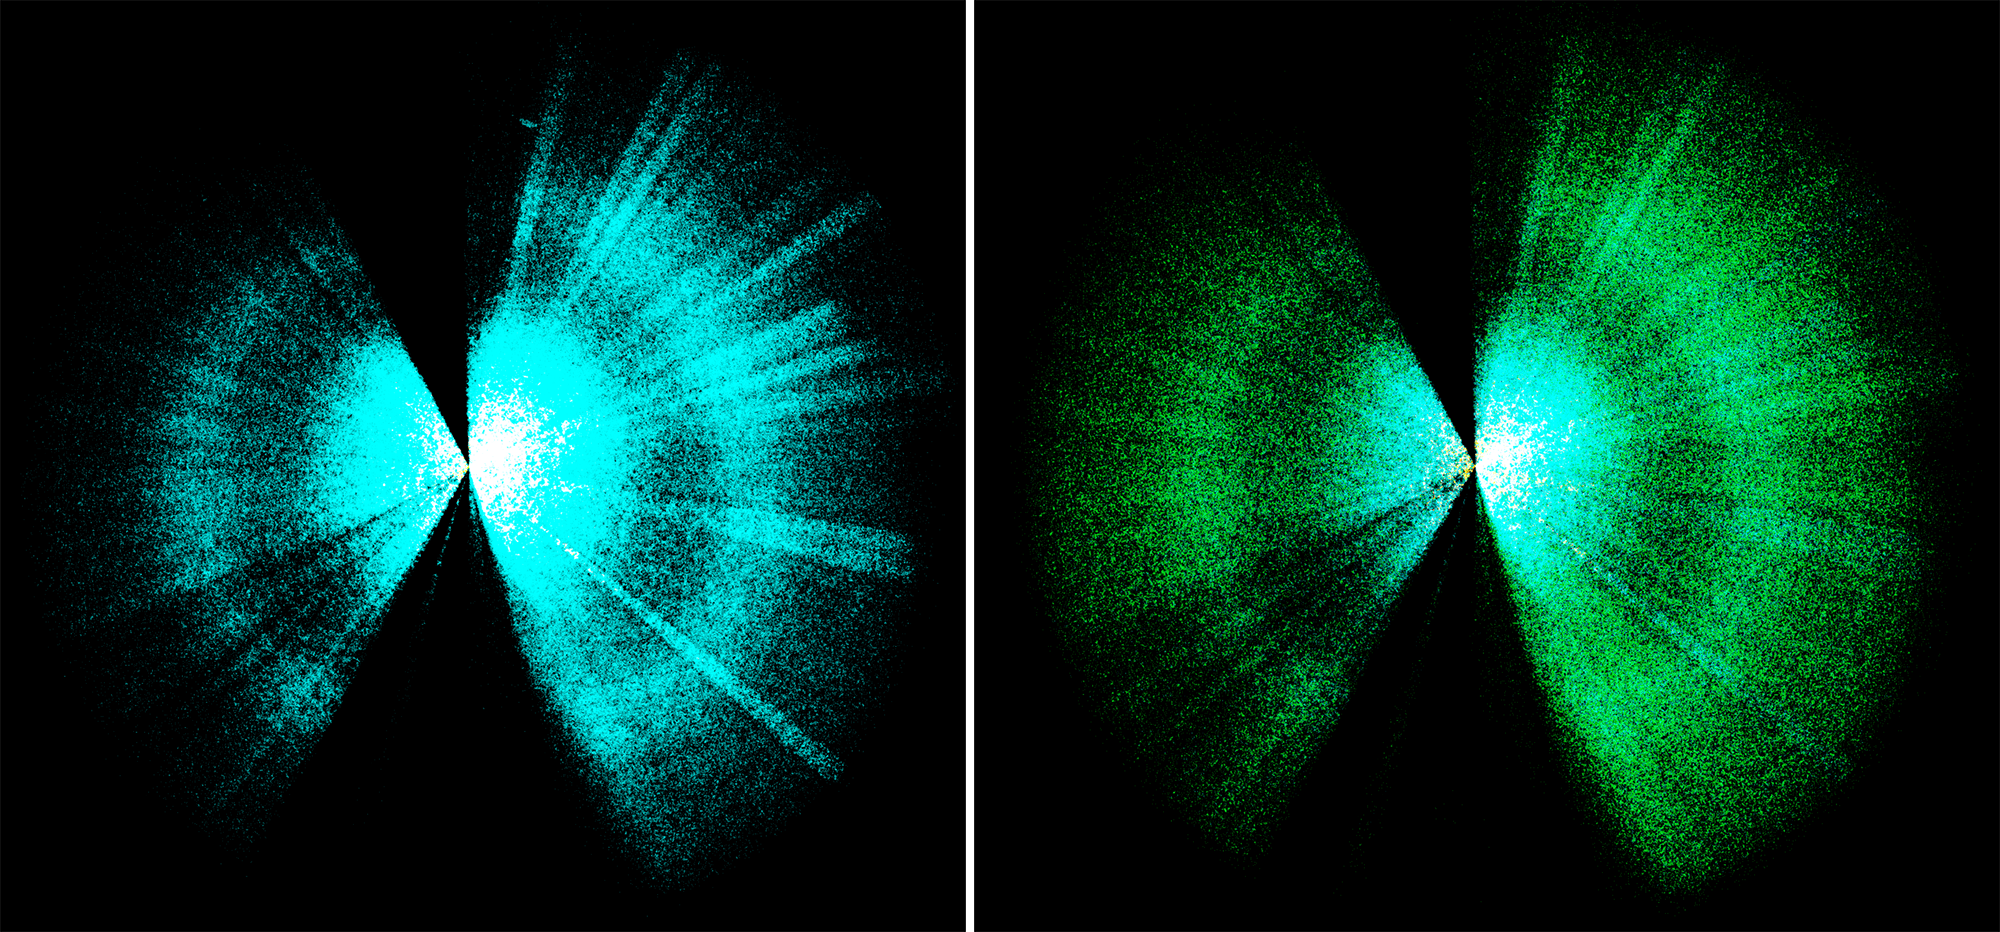
Reduced Versus Full Version Comparison. A two-panel figure of the DESI reduced galaxy data (left) and the full galaxy data (right). The green galaxies in the full data are mostly removed from the reduced set becasue they are relatively isolated with no nearby neighbors.
Data Artifacts
You may notice some unexpected variations in these data. These are a function of how the data were observed. Some of these issues will improve in later DESI data releases.
Radial Overdensities
Rays, or beams, of more densely packed galaxies relative to the overall survey are merely areas where more observations were made. With subsequent data releases, these areas will be less conspicuous.
Concentric Overdensity
The “ring” of overdensity around redshift 0.7–1.0, or a distance of about 8–11 billion light years, is caused by the overlap of two separate subsurveys. The inner luminous red galaxy survey overlaps with the more distant emission-line galaxy survey, two of the region-based surveys that make up the DESI survey.
The innermost survey, the bright galaxy survey, is most dense near the Milky Way, and begins tailing off naturally as the distance increases. However, as this fade happens, the luminous red galaxies start to fill in, causing the density to increase a bit. Then the emission-line galaxies kick in too, overlapping with the red luminous galaxies and causing a ring of increased density. Obviously, this is not a real structure in the universe. Then, the emission-line survey eventually fades with distance.
Profiles
Note
By default, these data sets are not part of any profile.
You must add one or both of these into a profile via the Profile Editor. Or, use the Addons menu in the Launcher Window to add them.
Dossier
DESI Galaxies Reduced
Census: |
8,487,278 galaxies |
|---|---|
Asset File: |
|
OpenSpace Version: |
1 |
Reference: |
|
Prepared by: |
Cade Mohrhardt (AMNH), Brian Abbott (AMNH) |
Source Version: |
1.01 |
License: |
DESI Galaxies Full
Census: |
14,633,224 galaxies |
|---|---|
Asset File: |
|
OpenSpace Version: |
1 |
Reference: |
|
Prepared by: |
Cade Mohrhardt (AMNH), Brian Abbott (AMNH) |
Source Version: |
1.01 |
License: |